2023
Pivot Table UX & Design System
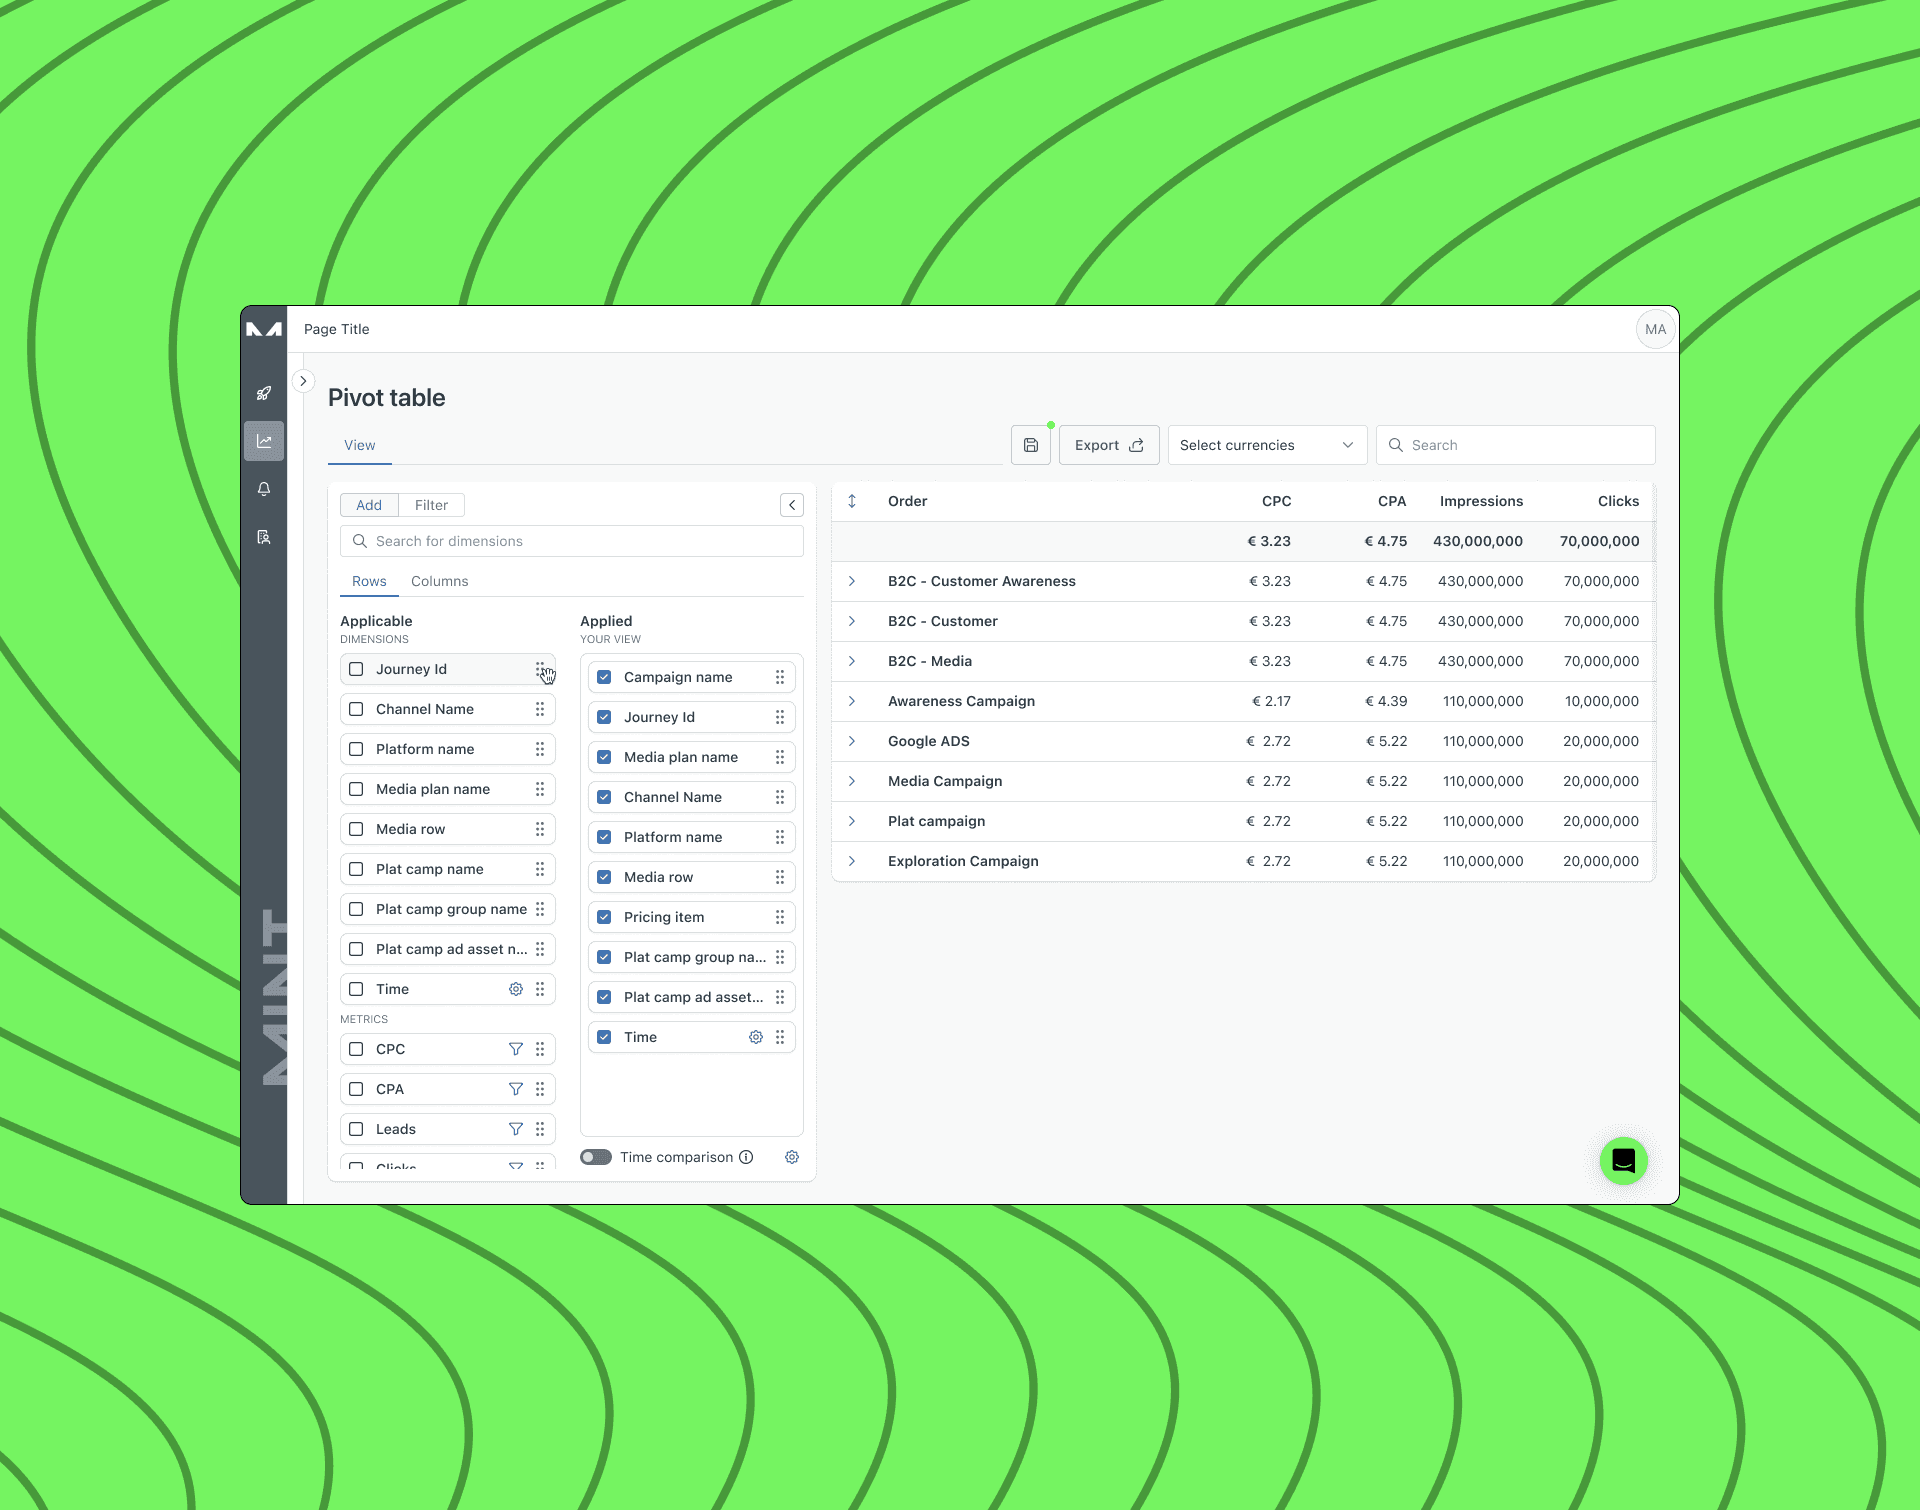
Pivot tables are a fundamental tool for data analysis, used by professionals across various industries to summarize, manipulate, and visualize complex datasets. This project aimed to redefine the user experience of pivot tables, making them more intuitive, efficient, and accessible, while ensuring seamless integration with existing enterprise data workflows.
UX
Research
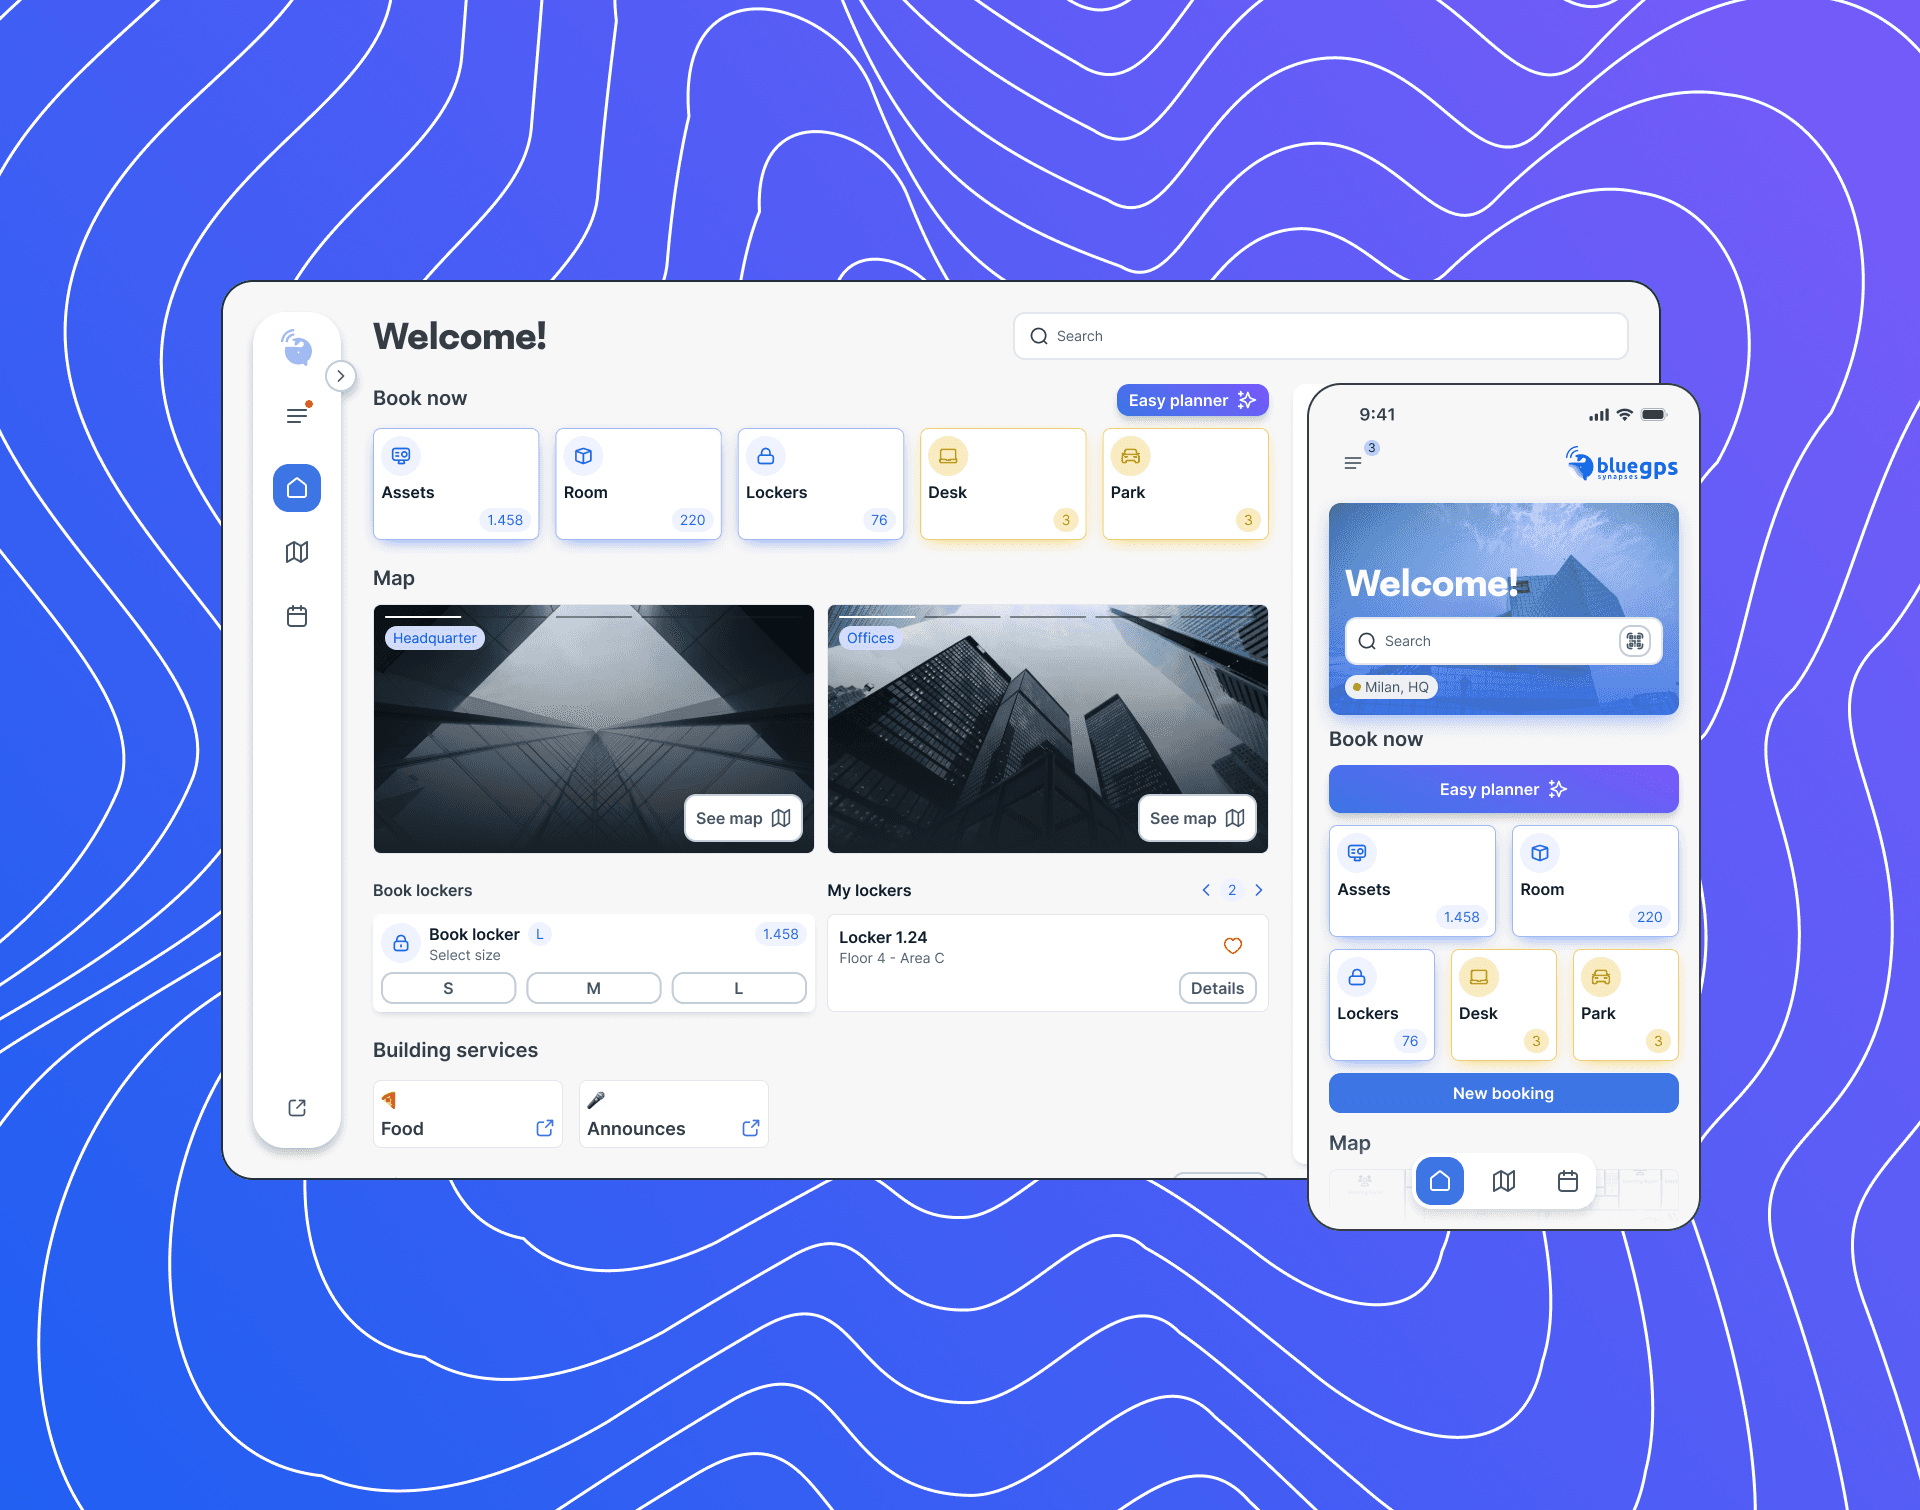
A scalable, research-driven UX solution for data analysis and visualization.
The best way to analyze marketing data from different pools of data sources. All in one simple and scalable solution.
Research & Insights
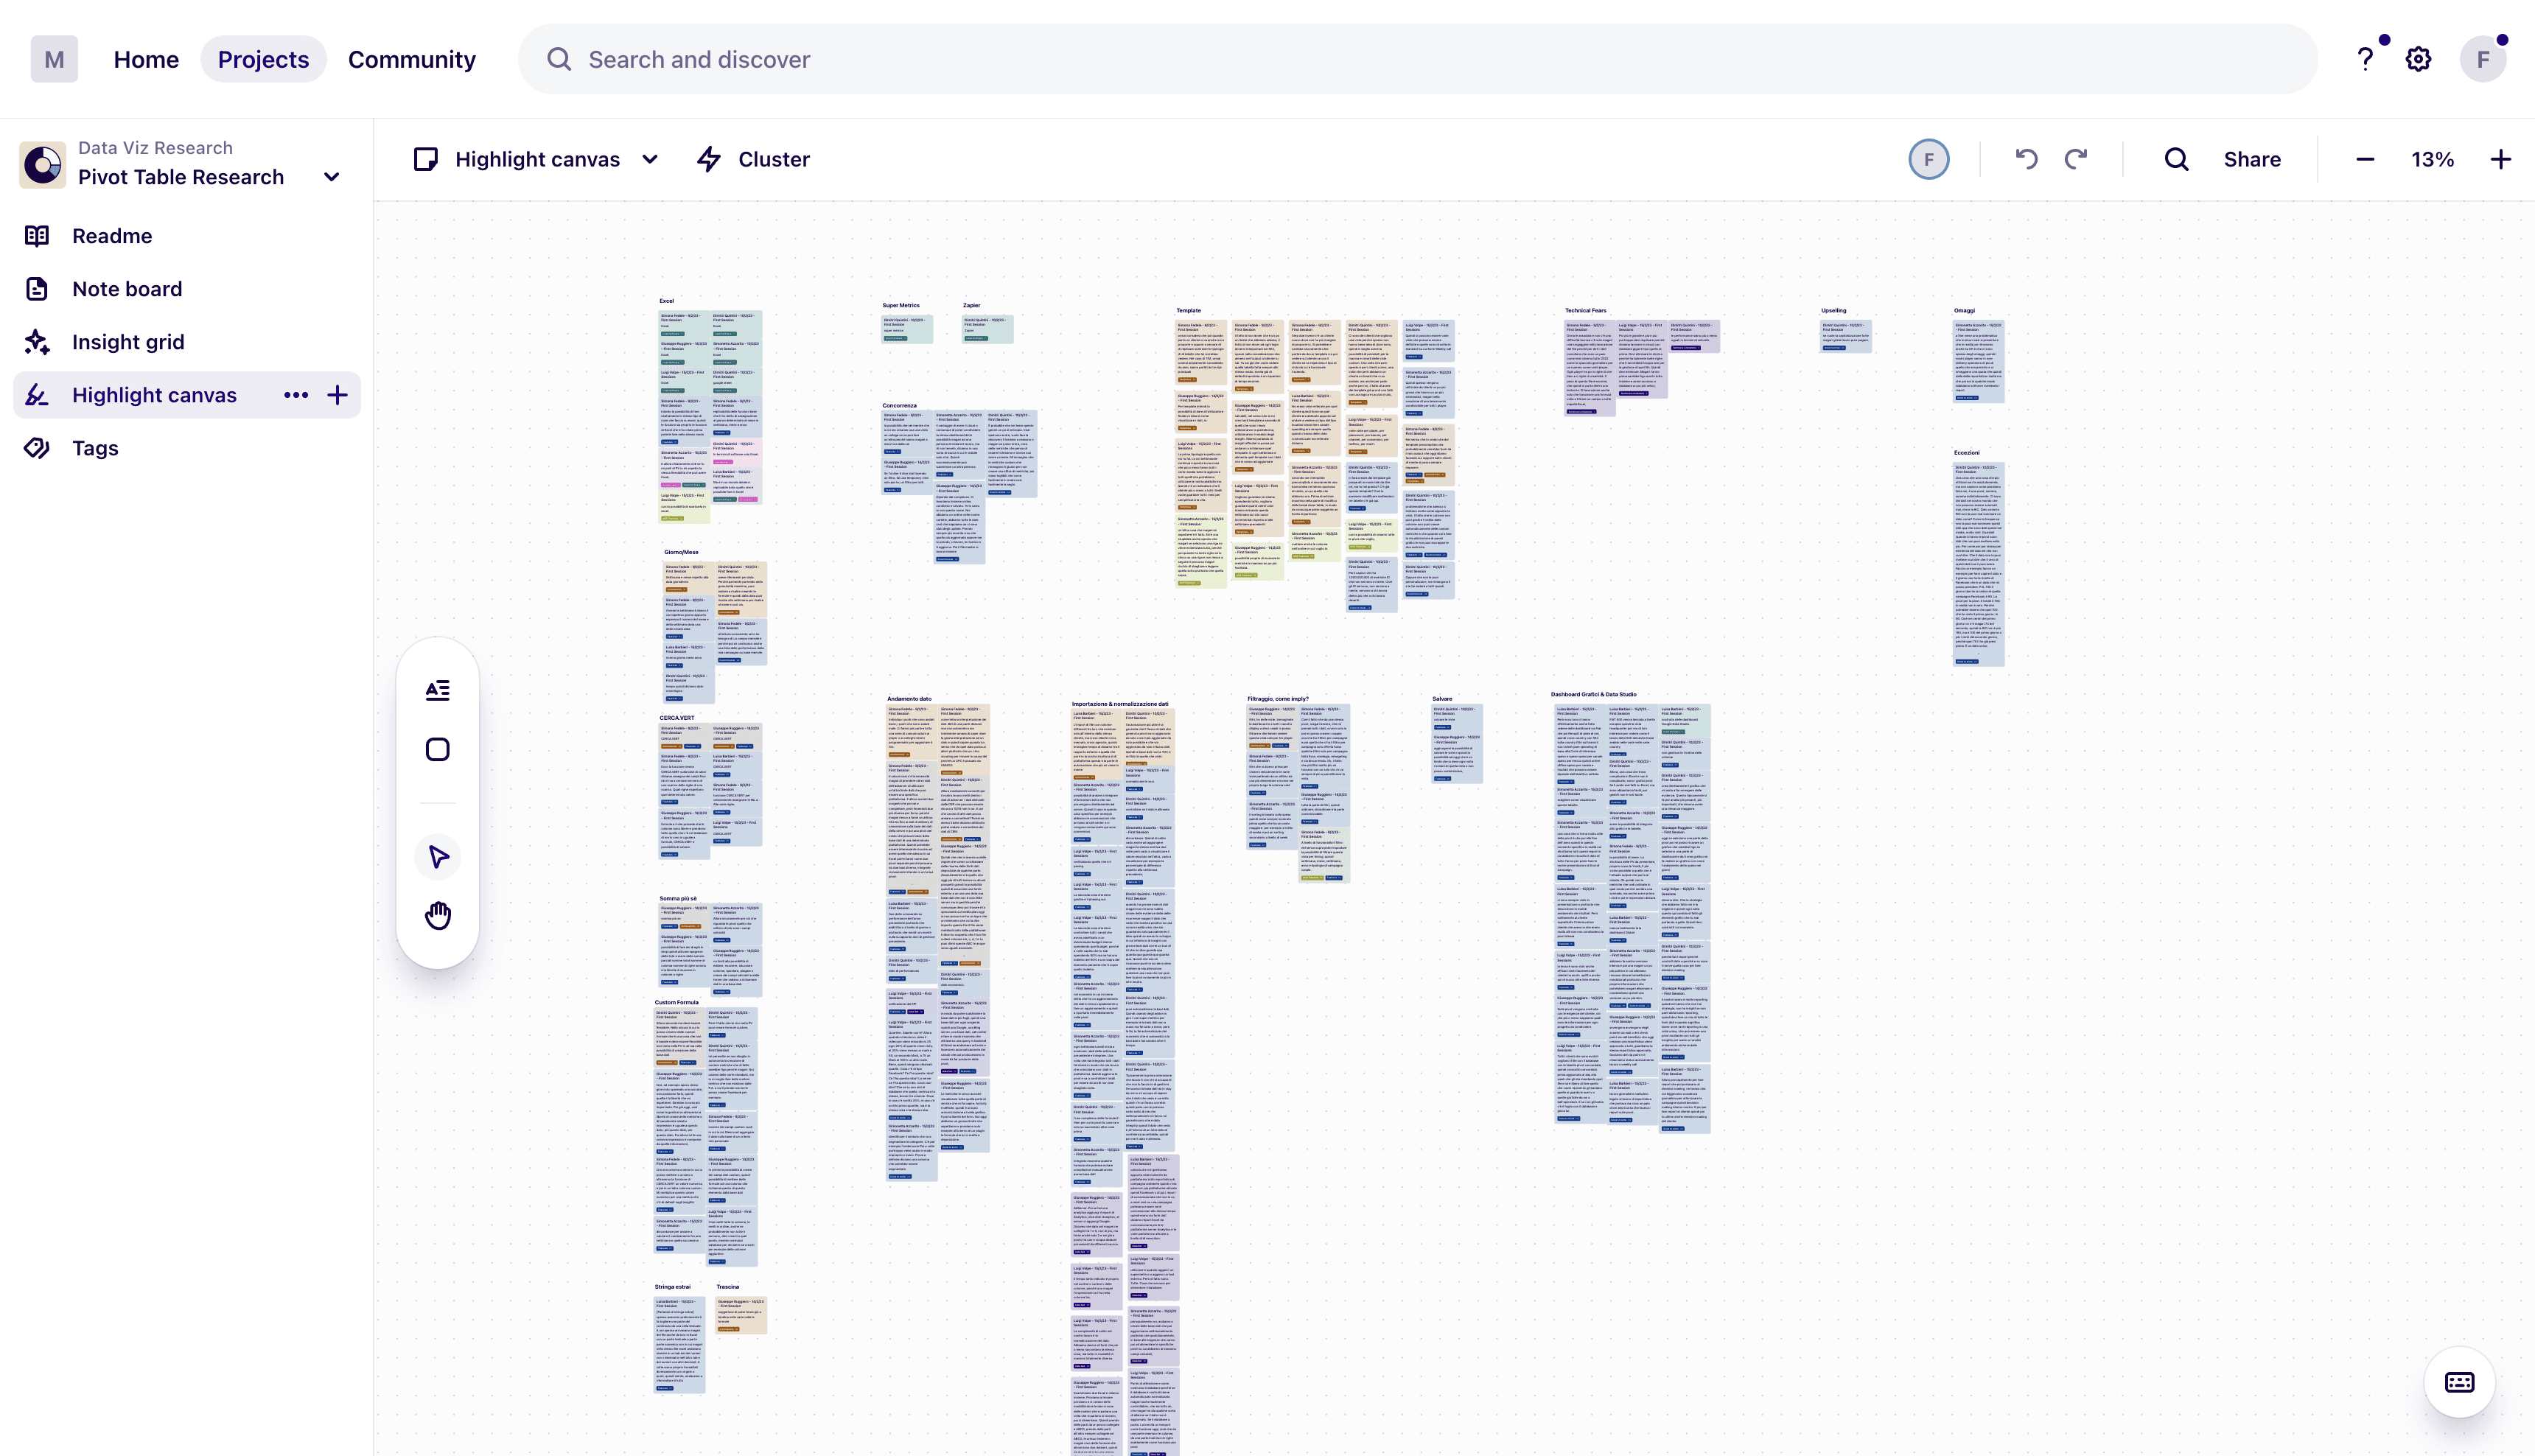
Understanding user behavior was crucial for designing an intuitive pivot table experience.
The research included:
User Interviews & Testing – Conducted one-on-one sessions to understand user frustrations and workflow challenges.
Competitive Analysis – Benchmarked against Tableau, Power BI, Looker, and QlikView to identify UX gaps.
Maze A/B Testing – Compared drag-and-drop vs. structured input methods, optimizing usability and interaction flows.
Data Prioritization Study – Identified must-have vs. optional features to streamline MVP development.
Key Insight: Users required real-time collaboration, automation, and customizable views, which were missing in competitor solutions.
Problem
Most existing pivot table interfaces were:
Overly complex, requiring extensive training.
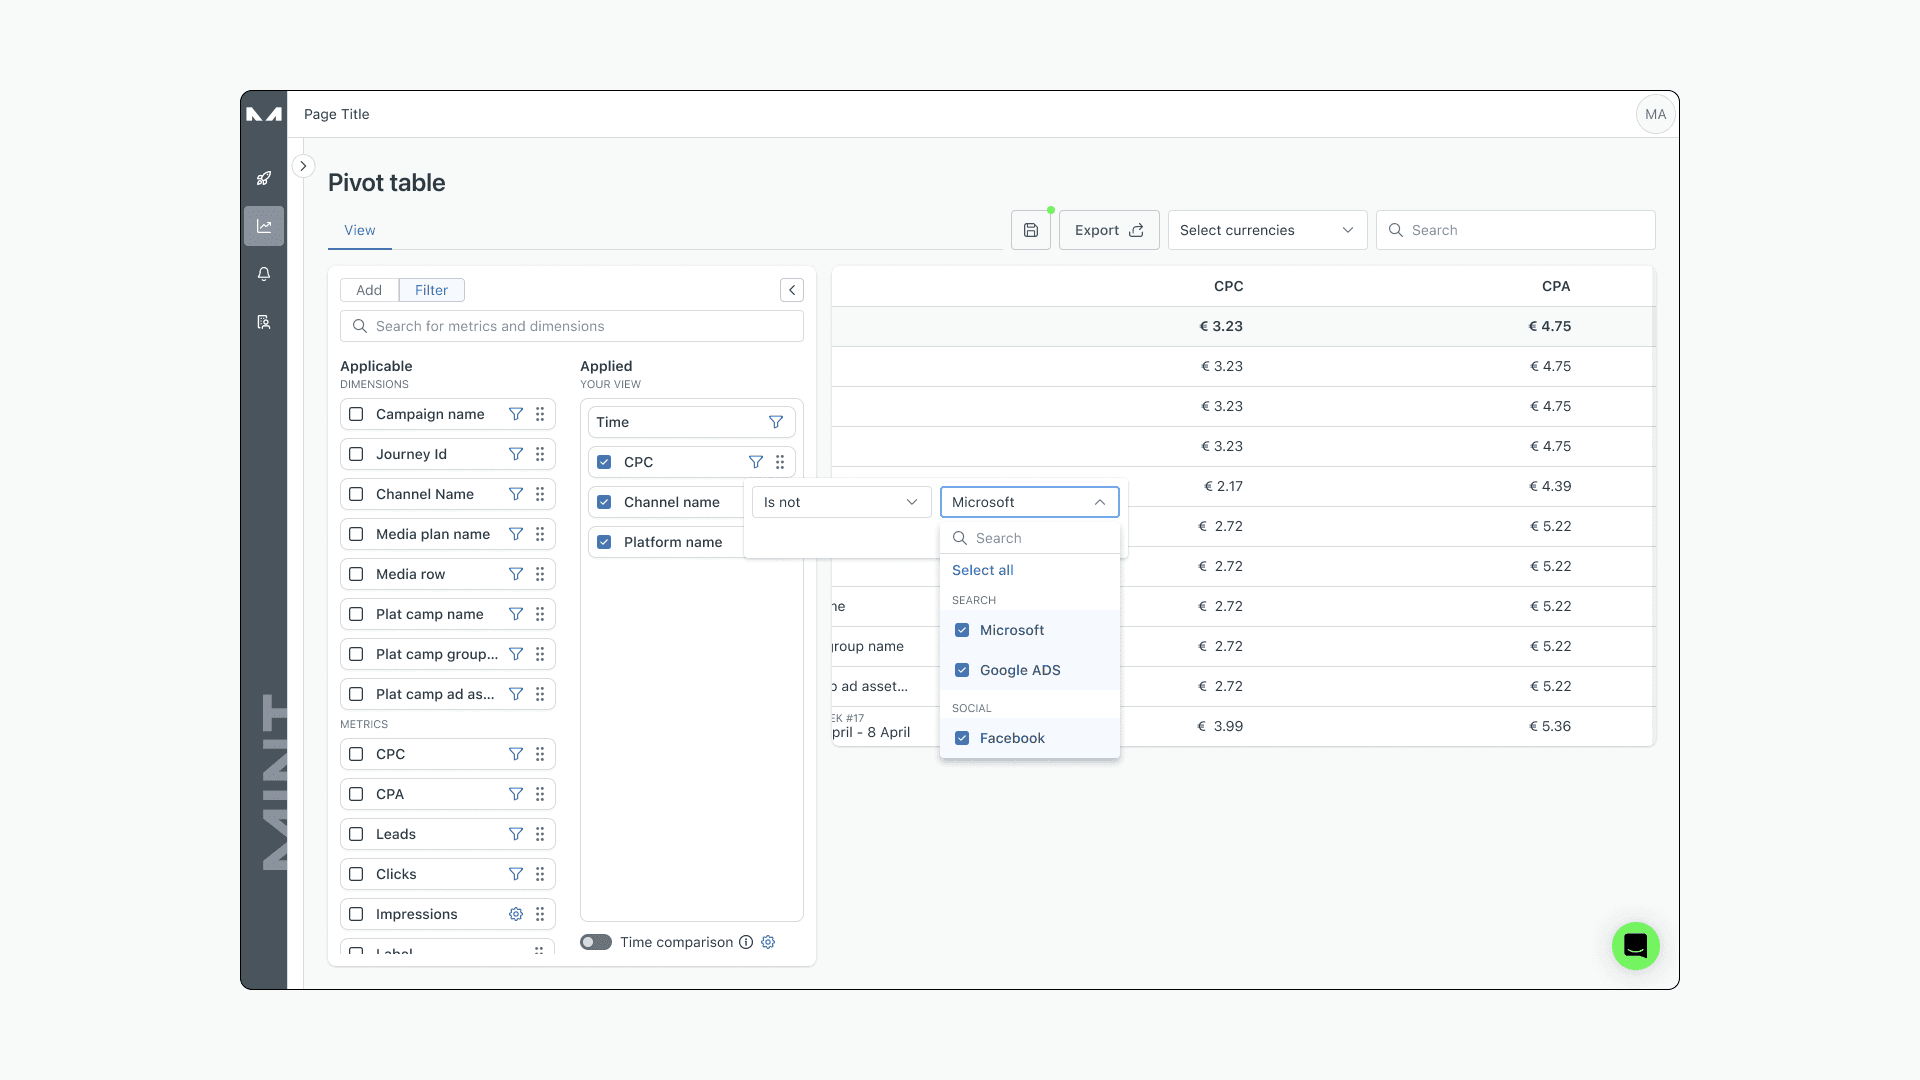
Lacked customization, limiting user control over data visualization.
Slow & non-collaborative, hindering real-time decision-making.
The goal was to create a UX-first, scalable pivot table solution with custom metrics, drag-and-drop functionality, real-time updates, and seamless team collaboration.
Solution & Execution
UX & UI Strategy
🔹 Designed a modular UI framework that adapts to different user roles (Analysts, PMs, Executives).
🔹 Improved data interaction flows, making it easier to manipulate datasets.
🔹 Introduced a component-based approach, enabling future scalability.
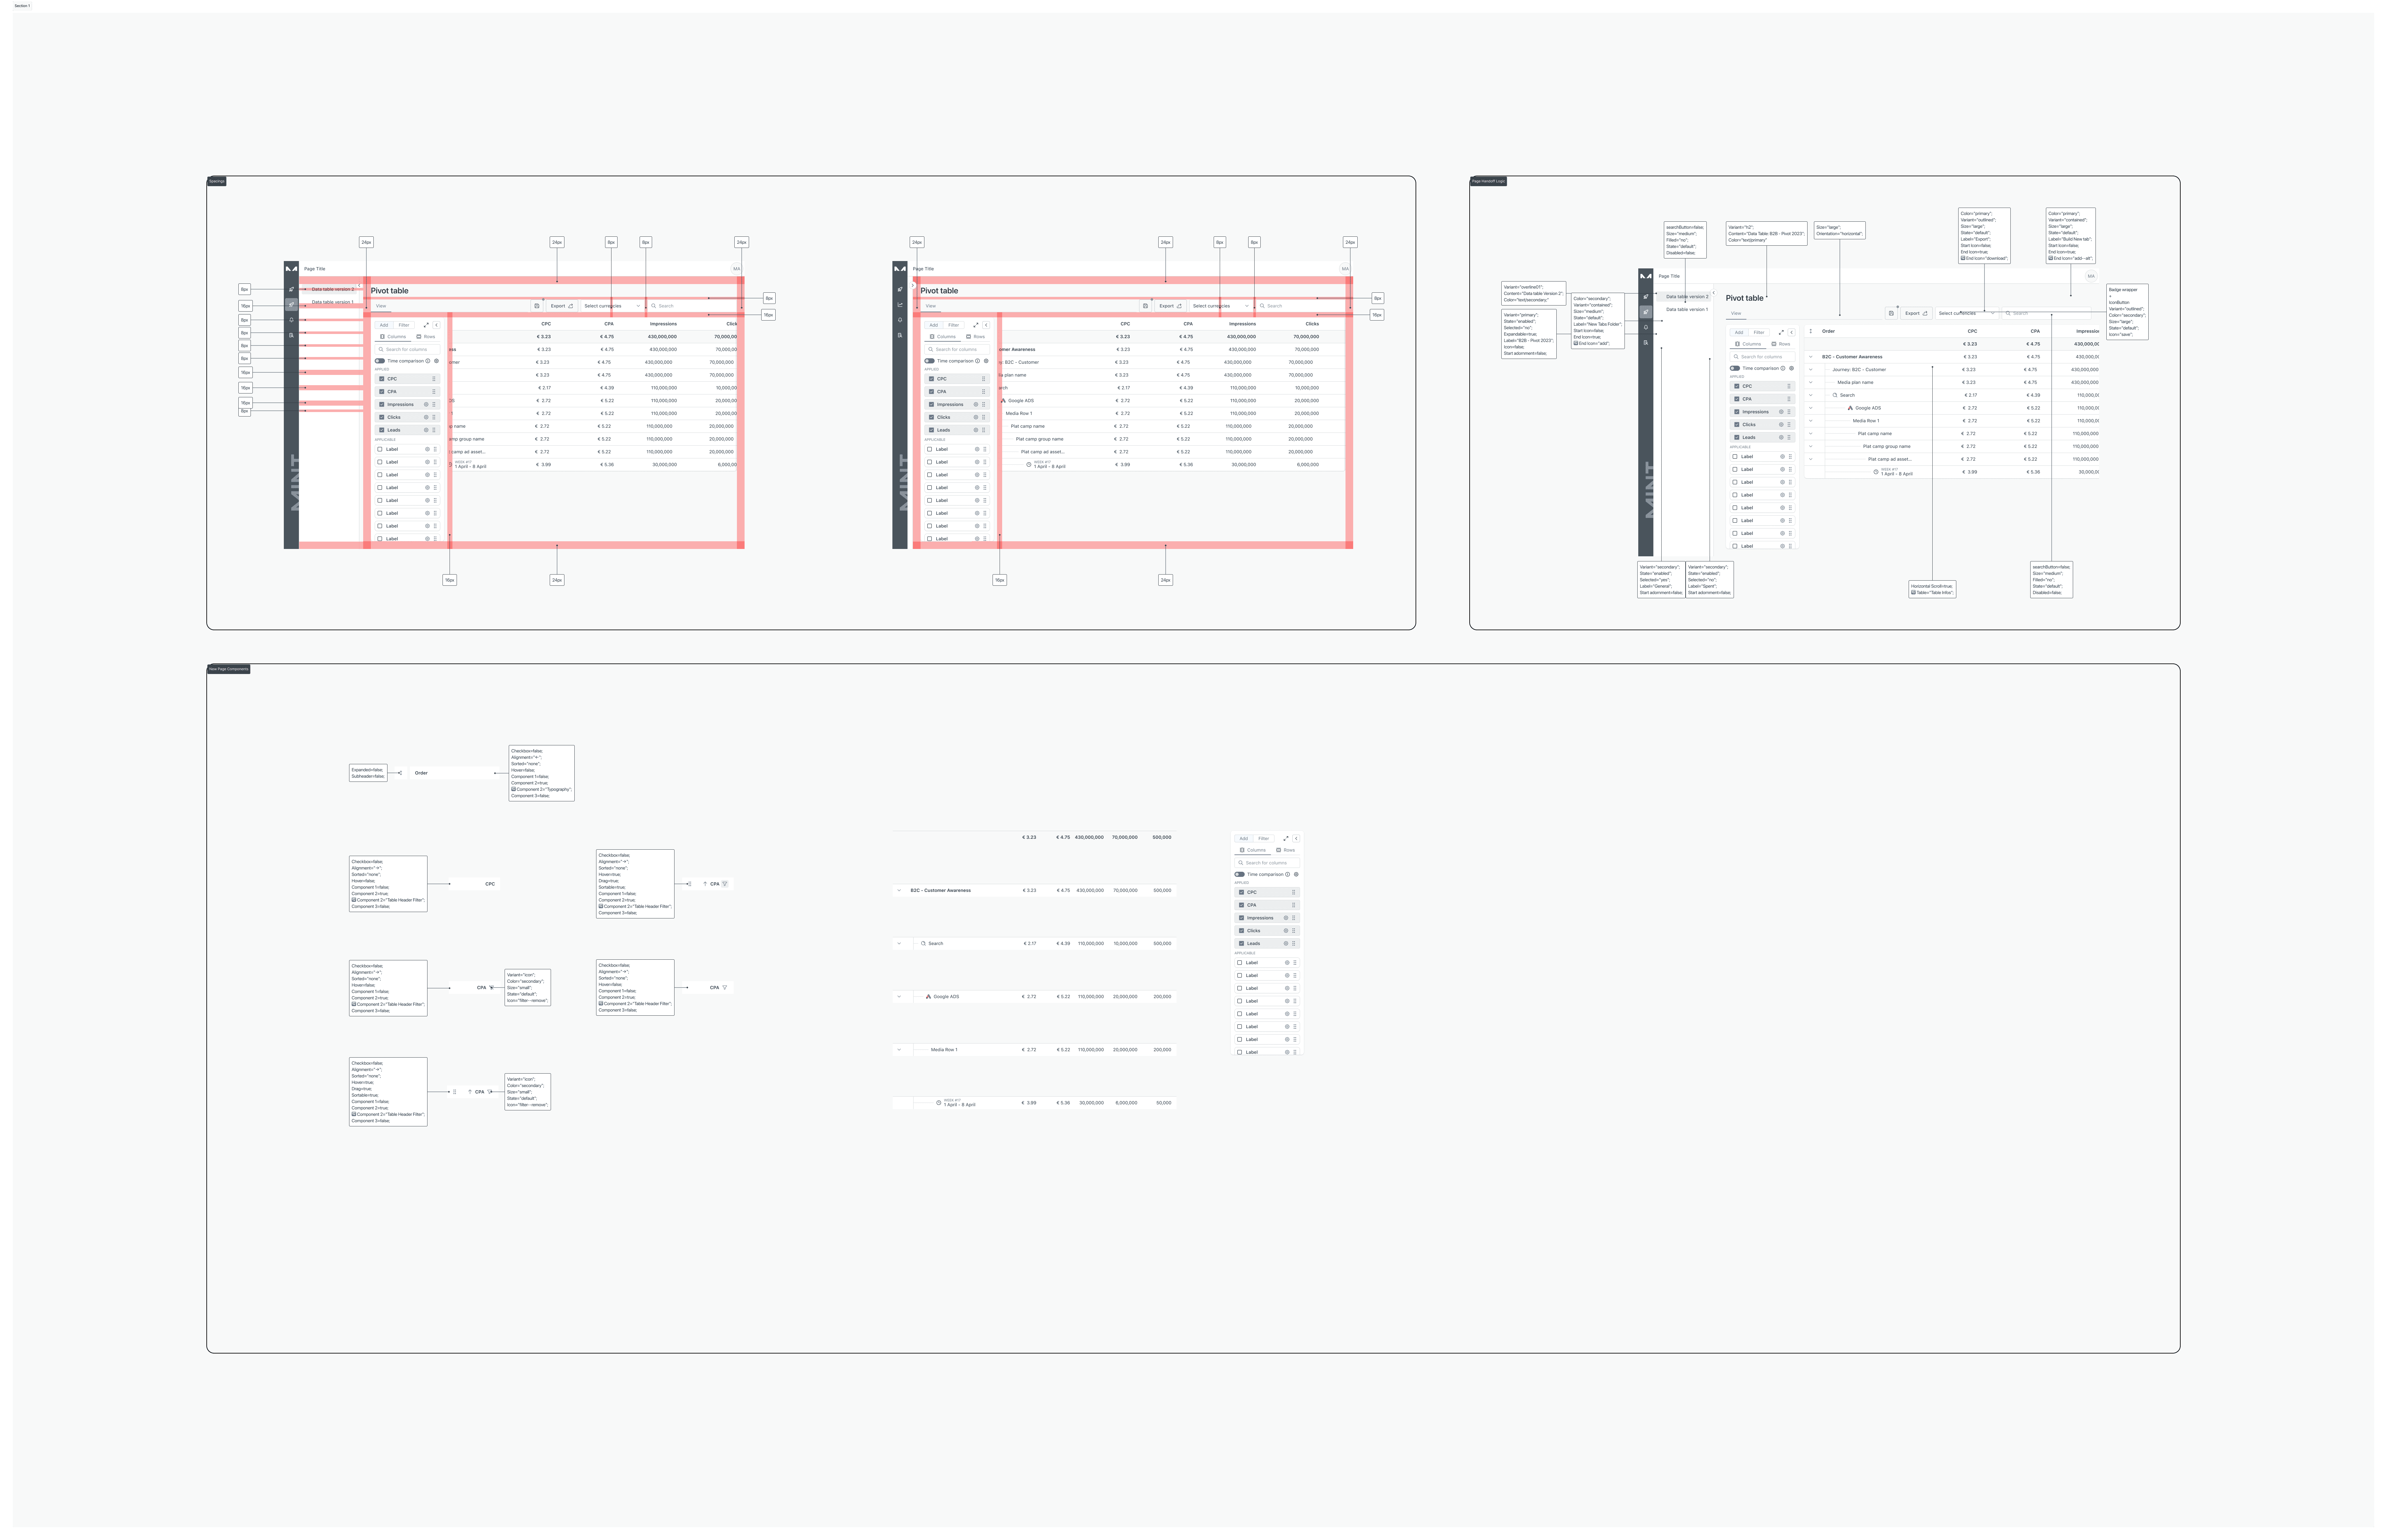
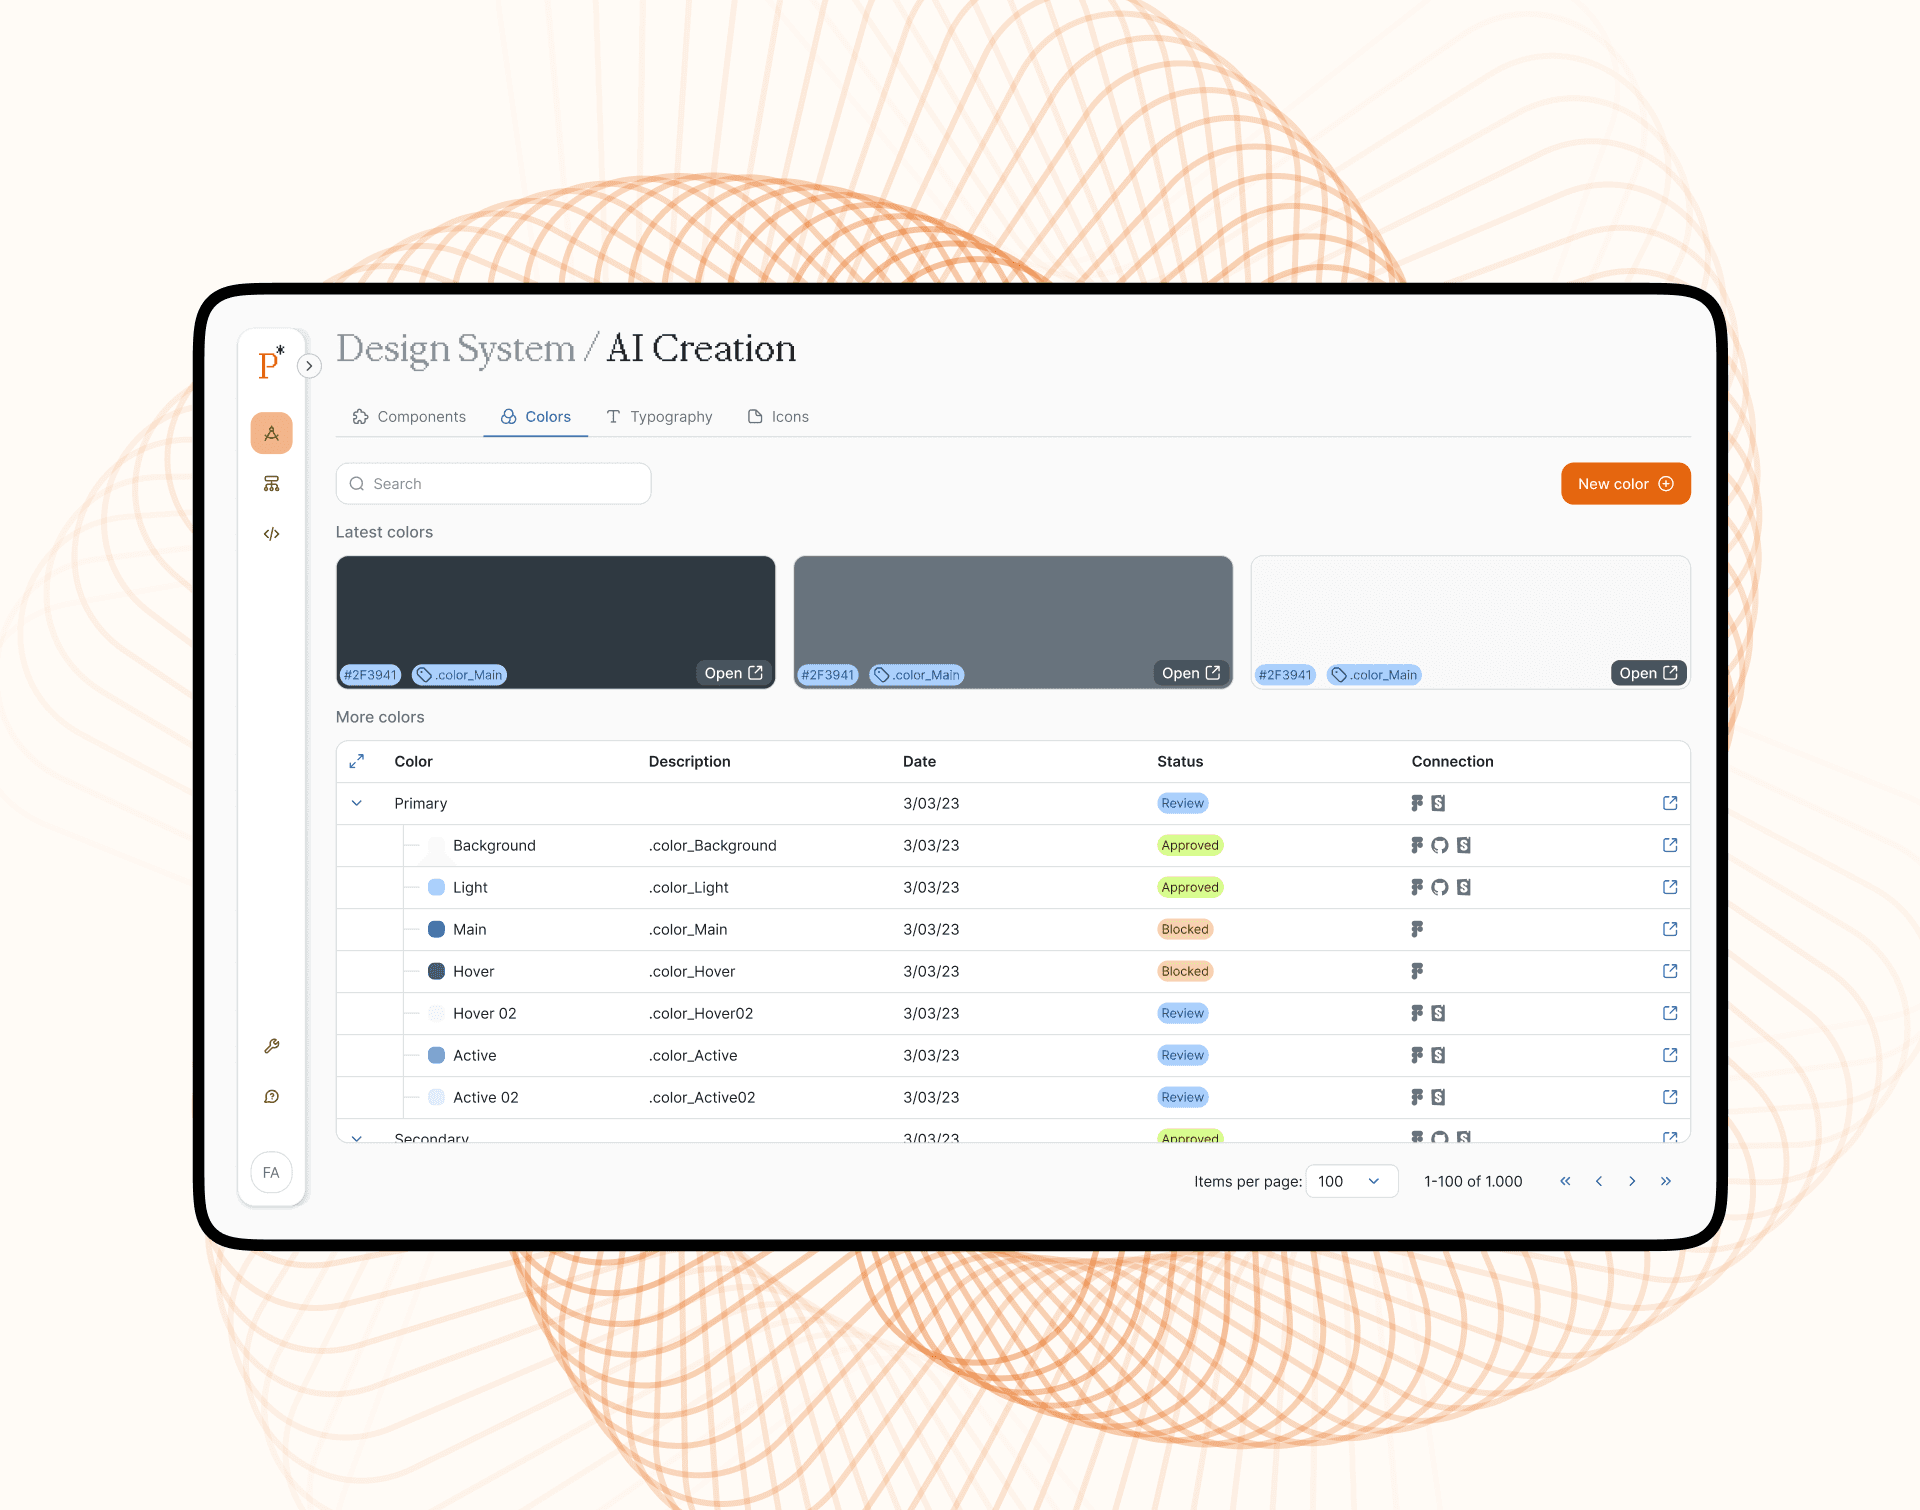
Design System Implementation
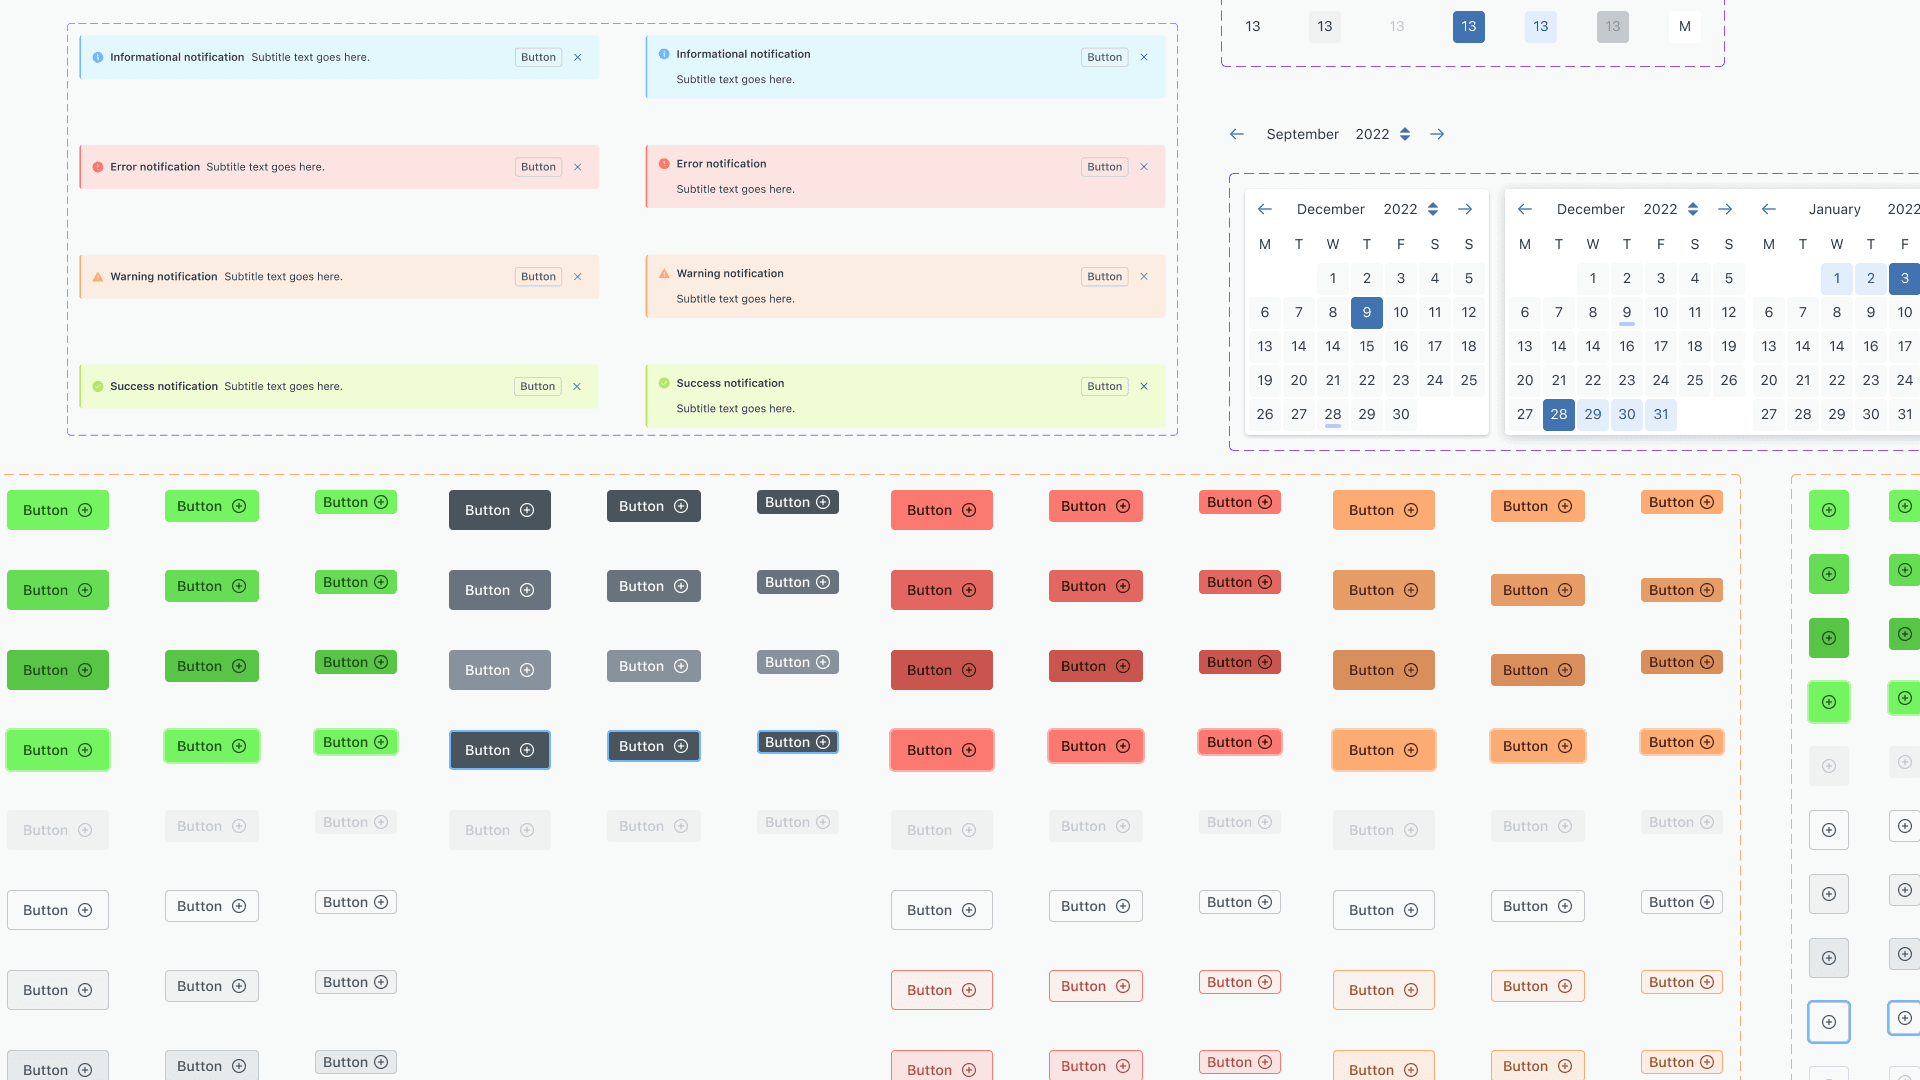
🎨 Built a comprehensive Figma design system, ensuring consistency across multiple views and interactions.
📏 Established typography, color schemes, and component libraries for seamless developer handoff.
🔧 Integrated interactive prototypes to simulate real-world pivot table interactions.
Developer Handoff & Collaboration
💻 Created structured documentation to guide developers through design logic and behavior.
📂 Provided detailed UI specifications and accessibility guidelines to streamline front-end implementation.
📊 Worked closely with engineers to refine micro-interactions and optimize performance.
✅ Enhanced Usability – 94.6% completion rate in A/B usability tests, reducing cognitive load.
✅ Faster Onboarding – Reduced user learning time by 30% through intuitive UI patterns.
✅ Scalable Design – Enabled easy future updates via modular design system.
✅ Seamless Collaboration – Real-time multi-user editing increased productivity in cross-functional teams.
Concept
This project successfully transformed the pivot table experience, combining user-centric research, structured UI design, and efficient developer collaboration. The result is a scalable, modernized pivot table interface that enhances productivity, usability, and team collaboration.
🚀 Extra steps on handoff:
Iterating based on live user feedback & performance analytics.
Expanding AI-powered automation features for predictive insights.
Integrating cross-platform compatibility for seamless enterprise adoption.
More Works
(GQ® — 02)
©2024
FAQ
01
What makes you the right fit for my project?
02
Can you manage a full product development lifecycle?
03
What industries have you worked with?
04
How do you ensure design decisions align with business goals?
05
What’s your leadership style as senior UX?
06
Can you help scale a product post-launch?
07
Do you work best as an independent consultant or part of a team?
08
How do we get started?
2023
Pivot Table UX & Design System
Pivot tables are a fundamental tool for data analysis, used by professionals across various industries to summarize, manipulate, and visualize complex datasets. This project aimed to redefine the user experience of pivot tables, making them more intuitive, efficient, and accessible, while ensuring seamless integration with existing enterprise data workflows.
UX
Research
A scalable, research-driven UX solution for data analysis and visualization.
The best way to analyze marketing data from different pools of data sources. All in one simple and scalable solution.
Research & Insights
Understanding user behavior was crucial for designing an intuitive pivot table experience.
The research included:
User Interviews & Testing – Conducted one-on-one sessions to understand user frustrations and workflow challenges.
Competitive Analysis – Benchmarked against Tableau, Power BI, Looker, and QlikView to identify UX gaps.
Maze A/B Testing – Compared drag-and-drop vs. structured input methods, optimizing usability and interaction flows.
Data Prioritization Study – Identified must-have vs. optional features to streamline MVP development.
Key Insight: Users required real-time collaboration, automation, and customizable views, which were missing in competitor solutions.
Problem
Most existing pivot table interfaces were:
Overly complex, requiring extensive training.
Lacked customization, limiting user control over data visualization.
Slow & non-collaborative, hindering real-time decision-making.
The goal was to create a UX-first, scalable pivot table solution with custom metrics, drag-and-drop functionality, real-time updates, and seamless team collaboration.
Solution & Execution
UX & UI Strategy
🔹 Designed a modular UI framework that adapts to different user roles (Analysts, PMs, Executives).
🔹 Improved data interaction flows, making it easier to manipulate datasets.
🔹 Introduced a component-based approach, enabling future scalability.
Design System Implementation
🎨 Built a comprehensive Figma design system, ensuring consistency across multiple views and interactions.
📏 Established typography, color schemes, and component libraries for seamless developer handoff.
🔧 Integrated interactive prototypes to simulate real-world pivot table interactions.
Developer Handoff & Collaboration
💻 Created structured documentation to guide developers through design logic and behavior.
📂 Provided detailed UI specifications and accessibility guidelines to streamline front-end implementation.
📊 Worked closely with engineers to refine micro-interactions and optimize performance.
✅ Enhanced Usability – 94.6% completion rate in A/B usability tests, reducing cognitive load.
✅ Faster Onboarding – Reduced user learning time by 30% through intuitive UI patterns.
✅ Scalable Design – Enabled easy future updates via modular design system.
✅ Seamless Collaboration – Real-time multi-user editing increased productivity in cross-functional teams.
Concept
This project successfully transformed the pivot table experience, combining user-centric research, structured UI design, and efficient developer collaboration. The result is a scalable, modernized pivot table interface that enhances productivity, usability, and team collaboration.
🚀 Extra steps on handoff:
Iterating based on live user feedback & performance analytics.
Expanding AI-powered automation features for predictive insights.
Integrating cross-platform compatibility for seamless enterprise adoption.
More Works
©2024
FAQ
What makes you the right fit for my project?
Can you manage a full product development lifecycle?
What industries have you worked with?
How do you ensure design decisions align with business goals?
What’s your leadership style as senior UX?
Can you help scale a product post-launch?
Do you work best as an independent consultant or part of a team?
How do we get started?